There is a lot of focus on CO2 lately. But we’re missing something insanely important, again.
A lot of us have heard of the idea that indoor air quality is not the best, and most of us spend the majority of our time indoors.
But how many times have you heard of, or focused on indoor co2 levels?
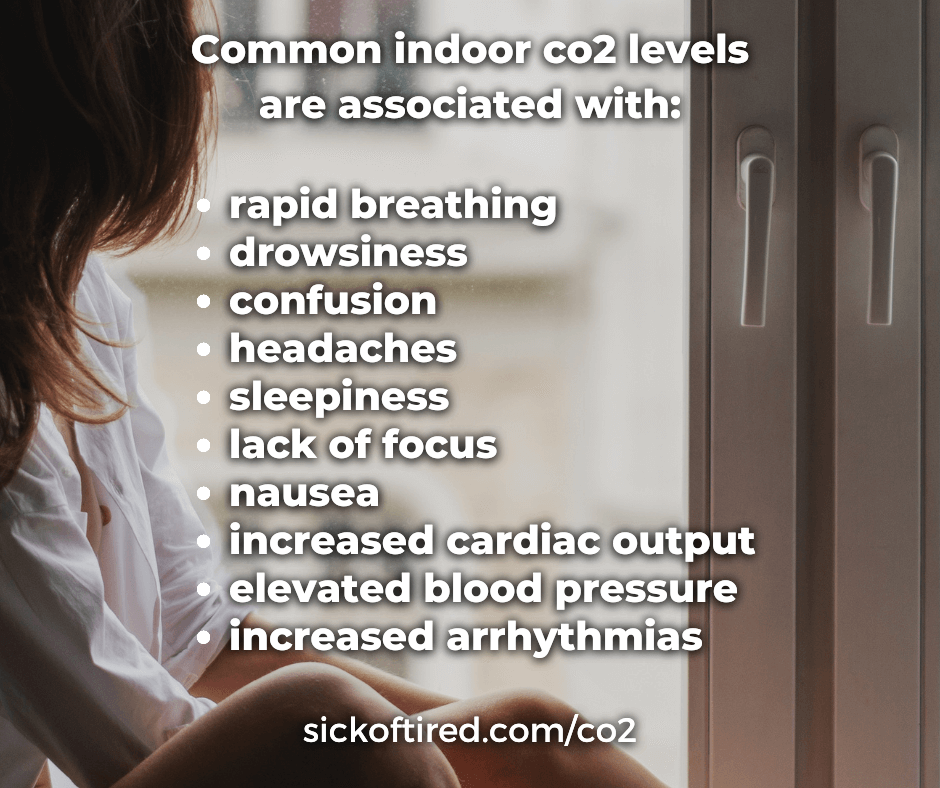
Common indoor CO2 levels are associated with negative health effects.
CO2 levels that most of us are breathing at various points of our day are associated with a bunch of common health ailments.
These symptoms and ailments include, but are not limited to:
- drowsiness
- confusion
- headaches
- sleepiness
- lack of focus
- nausea
- rapid breathing
- increased cardiac output
- elevated blood pressure
- increased arrhythmias
Keep in mind that these conditions I’ve listed are the only things I’m able to find some sort of solid data on. There are likely dozens and dozens of ailments that co2 contributes to in some way.
This means some of the health ailments a lot of us experience on a daily basis might be due to, or amplified by the co2 levels we experience on a daily basis.
This is potentially insanely important. I think indoor co2 levels of our homes, vehicles, and workplaces are making people dumb. Unless, you think drowsiness, confusion, lack of focus, and elevated blood pressure makes people.. smarter?
I think the indoor co2 levels in our vehicles are adding to or causing fatigue, drowsiness, lack of focus, elevated blood pressure.
Are you starting to piece this together like I have? Is indoor air poop causing us to mess up, be cranky, or have chronic health issues? I’m not sure how a person could argue otherwise. Sure, the effects might be minor, but they are never positive impacts.
What happens when a person already has a hard time harnessing oxygen from the atmosphere? What happens if someone has respiratory issues? What if we add mold or other toxins to this air? What if a person is constantly exposed to elevated co2 levels all day long?
Are co2 levels a major contributor to the 60% chronic illness rate in the US?
We’re not running any long term tests of co2’s contribution to other ailments, so it’s impossible to say no.
Ok we’re breathing our own air poop, now what?
As we exist, we breathe oxygen and turn it into co2. Depending on the size of the enclosed area we’re in, the oxygen in this space can be converted to co2 rather quickly. And then depending on the rate that fresh air is being exchanged into that space, the co2 levels may continue climbing while the oxygen level continues to drop. This eventually leads to suffocation if the oxygen levels drop enough. Suffocation would require a very small space with no air exchange, but I am just mentioning this to help show how smaller and smaller spaces fill up with co2 much more quickly.
I purchased a co2 meter and started testing the indoor air of my home, vehicle and other people’s homes. The results eventually started blowing my mind. We’re all breathing our own air poop at various amounts.
First I bought this meter for $130 after doing some research https://amzn.to/3pH1wJJ
Then as I write this, I ordered this one for $30 https://amzn.to/3TciDR6 and this one for $40 https://amzn.to/3R2gcP8 (the $40 one never showed up and was refunded)
I purchased the second and third one so I can compare their ability a bit while also keeping an eye on more areas of the house at the same time. I also plan on experimenting with several of them very close to where I am breathing as I sleep.
I also grabbed a blood oxygen meter that snaps on my finger for $12 https://amzn.to/3KlKni7 so I can see if various co2 levels influence my oxygen levels.
CO2 levels are elevated when the windows are closed
Not long after seeing some readouts from my co2 meter, I gave up the idea of sealing the house tight in order to minimize energy usage. I used to spend a good bit of time putting that plastic wrap stuff over the windows to help with energy costs. Now I would rather spend more on energy in an attempt to breathe cleaner air.
My house is 50 years old with windows that don’t seal well. If my house can cause the meter to elevate, a more modern house that is sealed better is likely going to have a bigger issue with this. My house is 1,000sq ft with two adults and two small dogs. But larger homes with similar occupants is reading about the same.
“400–1,000 ppm: typical level found in occupied spaces with good air exchange.” 1
But, “good air exchange” means the windows are open. Our current outdoor co2 level is 414ppm, so it’s just about impossible for indoor air to be that low.
Closed windows are elevating co2 levels in our vehicles as well
I have only had a chance to try the co2 meter during a car ride one time so far. But a 15 minute drive with the windows closed and AC on recycle brought the co2 levels to 1,700ppm within 15 minutes.
How I mitigate co2 levels in my home
I started opening my windows to allow fresh air while continue to watch the meter. I noticed the co2 level climbing to about 1400ppm on average by the time I wake up each morning. I usually keep the windows open or cracked in the day but my wife does not like windows open, especially while sleeping.
I usually get away with leaving a window open overnight in my office. But only having one window open will not exchange much air. The pressure needs to be released somewhere else in the house. Otherwise, the only air that will move is what is able to leak through various closed windows, doors, etc. But, this is better than nothing.
OSHA has a safety limit on co2
OSHA’s occupational exposure limit for indoor co2 is 5,000ppm. 2
The co2 levels of my house go up to 1,500 and 2,000ppm.
A 15 minute car ride brought the co2 to 1,700ppm.
Without paying attention, I could be breathing co2 levels that are halfway to what OSHA considers safe to work in. OSHA is not going to make up a random ppm, and 50% of something is a lot.
Where is the data to show these levels are bad?
There is a good big of data, but it’s not as easy as “CO2 is bad”, mainly because we live in a twisted world where ignoring bad stuff is good for business in a few dozen ways.
But this data here is about the best I’ve seen so far. Check out the results of some various levels of CO2.
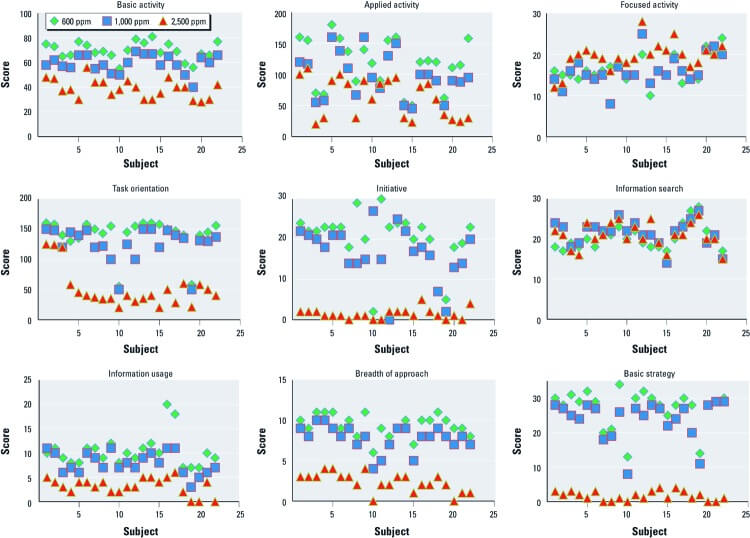
For some reason we seem to be able to focus a bit and search for information just fine at various levels of CO2.
But when it comes to strategy, having initiative or using more sources of information, we crash quickly once CO2 levels increase. 3 I personally think we’re witnessing co2 cause people to reach their current metabolic limit. And I think that limit is better or worse at various tasks due to the specific toxins most people are influenced by today. It’s rather interesting that we seem to be able to handle mindless tasks when our metabolism reaches its limit, but we lose our ability to actually think about things from different angles.
I still have to find or create some test data, but I have a feeling a lot of people end up at 2,500ppm in their vehicles and sometimes home and work.
Carbon Dioxide Levels May Predict Covid Risk In Your Immediate Surroundings – Forbes
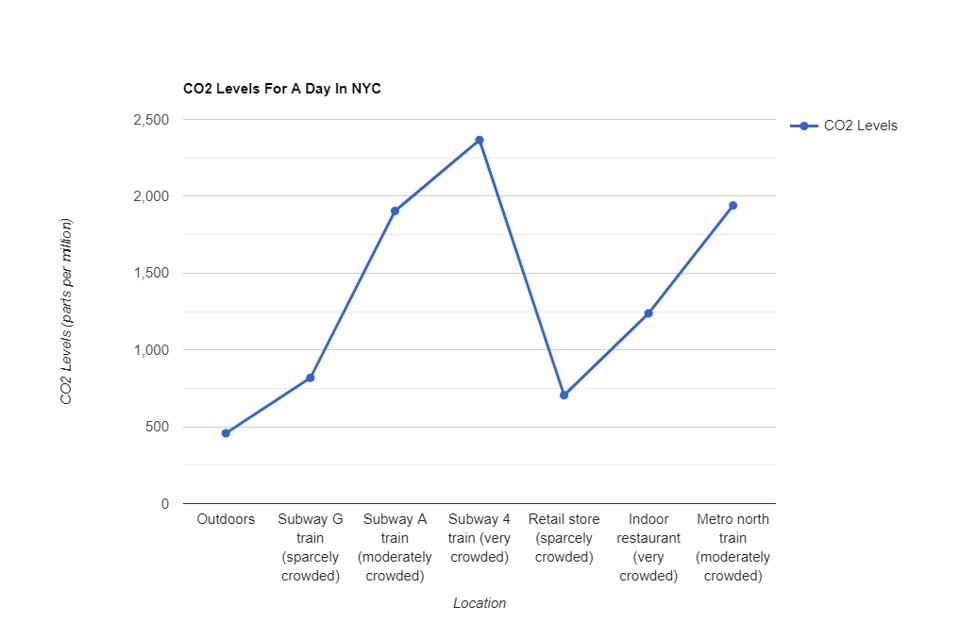
Typical co2 levels in New York City 4
Boarding an airplane is typically 1,800 ppm, and can get as high as 2,500 ppm. 5
Some data shows aircraft cabin reaching almost 3,000ppm 6
“Furthermore, urinary bicarbonate and pH were extensively increased, when 4 and 5 students made 3-hour car trip in two different cars with all windows closed, where carbon dioxide was increased up to about 5000 ppm within 1 hour” – 7
In 2000, data was compiled to show that even while remaining below 800ppm, there were still changes in people’s health – 8
Peak CO2 levels during round 1 and round 2 ranged from 665 ppm to 5000 ppm and 679 ppm to 4085 ppm, respectively. Mean CO2 levels (7 hours; highest exposure day) during round 1 and round 2, ranged from 471 ppm to 2633 ppm and 462 ppm 2675 ppm, respectively. Approximately 66.3% and 66.2% of teachers reported experiencing fatigue in the winter and late
spring seasons, respectively. The study findings revealed that the majority of the teachers (77.5% and 74.3%) reported experiencing health symptoms while at the school. 9
There is some scattered data about an oxidative stress marker that may be released as low as 400 – 1500ppm CO2 for some people, which is associated with eye dryness, nose itching, sneezing, dry throat, skin dryness and dizziness. – 10
CO2 exposure in young female Wistar rats exposed at 700ppm of CO2 during 6h a day for 15days. Prolonged CO2 exposure, though not continuous, produced significant disturbances in behavior with an increase in drinking, grooming and resting, and a reduction in rearing, jumping-play and locomotor activity. Furthermore, CO2 exposure was accompanied by increased plasma levels of corticosterone, suggesting that prolonged exposure to CO2 was stressful. – 11
Guinea pigs were subjected to 5,000ppm. After eight weeks of exposure, an increased kidney calcification, indicated by increased kidney calcium content, was found. Plasma calcium was significantly elevated at this point, apparently because of the release of calcium from bone. – 12
This page says 1000-2000ppm is associated with complaints of drowsiness and poor air quality. It also says 2000-5000ppm is associated with headaches, sleepiness, and stagnant, stale, stuffy air, poor concentration, loss of attention, increased heart rate and slight nausea – 13
This page says “At higher levels, rapid breathing, confusion, increased cardiac output, elevated blood pressure and increased arrhythmias may occur.” 14 But it doesn’t show the levels associated with those effects, it just jumps right to the OSHA 5000ppm limit
I have a feeling this page was pulled together in an attempt to make it seem like breathing our own co2 in a mask all day won’t be an issue. They are also mixing in chlimate cange stats to make it seem like co2 is going to be a huge issue, but we have no reason to worry about the cognitive disruption caused by it. Just keep eating glyphosate saturated “food” and drinking fluoride, everything is fine. But ya, this page has a lot of interesting data points that we can dig into further if we so choose. – 15
And if you are really digging into this co2 chlimate cange situation, this page about growing cannabis has a neat graph showing how plants uptake more co2 at higher temperature and amount of sunlight. Data surrounding cannabis is great because it is a high profit crop that benefits from maximizing its growth quality – 16
Help spread the world while helping me get around the censorship. Save and post this photo or copy and paste.
Footnotes
- Carbon Dioxide – https://www.dhs.wisconsin.gov/chemical/carbondioxide.htm
- Indoor Air Quality in Commercial and Institutional Buildings – https://www.osha.gov/sites/default/files/publications/3430indoor-air-quality-sm.pdf
- Is CO2 an Indoor Pollutant? Direct Effects of Low-to-Moderate CO2 Concentrations on Human Decision-Making Performance – https://www.ncbi.nlm.nih.gov/pmc/articles/PMC3548274/
- Carbon Dioxide Levels May Predict Covid Risk In Your Immediate Surroundings – https://www.forbes.com/sites/williamhaseltine/2022/06/23/carbon-dioxide-levels-may-predict-covid-risk-in-your-immediate-surroundings/
- Why the airline industry might want to lower cockpit CO2 levels – https://www.cbc.ca/radio/quirks/august-11-2018-climate-change-attribution-for-extreme-weather-cockpit-air-quality-and-more-1.4779504/why-the-airline-industry-might-want-to-lower-cockpit-co2-levels-1.4779538
- Preliminary cabin air quality measurement
campaign – https://www.easa.europa.eu/sites/default/files/dfu/EASA%20CAQ%20Study%20Final%20Report_21.03.2017.pdf - Significance of rises in urinary bicarbonate contents and pH related with increased atmospheric carbon dioxide in Tokyo – https://pubmed.ncbi.nlm.nih.gov/9453118/
- Associations between indoor CO2 concentrations and sick building syndrome symptoms in U.S. office buildings: an analysis of the 1994-1996 BASE study data – https://www.epa.gov/sites/default/files/2014-08/documents/indoorair20-247.pdf
- THE ASSOCIATION OF HIGHER CARBON DIOXIDE LEVELS AND TEACHERS’ PERCEIVED AIR QUALITY AND WELL BEING IN NEW YORK CITY ELEMENTARY SCHOOLS — https://academicworks.cuny.edu/cgi/viewcontent.cgi?article=1038&context=sph_etds
- Oxidative Stress Associated with Indoor Air Pollution and Sick Building Syndrome-Related Symptoms among Office Workers in Taiwan – https://www.researchgate.net/publication/6670088_Oxidative_Stress_Associated_with_Indoor_Air_Pollution_and_Sick_Building_Syndrome-Related_Symptoms_among_Office_Workers_in_Taiwan
- Effects of prolonged exposure to CO 2 on behaviour, hormone secretion and respiratory muscles in young female rats – https://www.researchgate.net/publication/316873387_Effects_of_prolonged_exposure_to_CO_2_on_behaviour_hormone_secretion_and_respiratory_muscles_in_young_female_rats
- Effect of prolonged exposure to 0.5% CO2 on kidney calcification and ultrastructure of lungs – https://pubmed.ncbi.nlm.nih.gov/505623/
- Carbon Dioxide – https://www.dhs.wisconsin.gov/chemical/carbondioxide.htm
- Carbon Dioxide Health Hazard Information Sheet – https://www.fsis.usda.gov/sites/default/files/media_file/2020-08/Carbon-Dioxide.pdf
- Impacts of Changes in Atmospheric O2 on Human Physiology. Is There a Basis for Concern? – https://www.frontiersin.org/articles/10.3389/fphys.2021.571137/full
- Cannabis And CO2: Why Plants Suffer If They Don’t Get At Least A Minimum Amount Of CO2 – https://www.edrosenthal.com/the-guru-of-ganja-blog/why-co2-is-critical-for-cannabis